Earth's Vital Signs
•
Delve into the key indicators of our planet's health, as monitored by satellite imagery from NASA's EPIC camera aboard the DSCOVR spacecraft. These "vital signs" provide crucial data on Earth's atmosphere, surface, and ecosystems, helping scientists track environmental changes and climate trends. On DailyEarthView.com, the daily full-disk images serve as a visual gateway to these metrics, revealing subtle shifts in clouds, vegetation, and more through our interactive slider and archive. Let's examine how EPIC contributes to understanding Earth's well-being.
What Are Earth's Vital Signs?
Earth's vital signs are essential measurements that reflect the planet's environmental health, much like a doctor's check-up for the human body. They include atmospheric composition (e.g., ozone and aerosols), cloud properties, vegetation cover, UV radiation levels, and pollutants like sulfur dioxide (SO₂). These indicators help detect changes driven by natural events (e.g., volcanoes) or human activities (e.g., emissions), informing climate models, air quality forecasts, and ecosystem management.
Satellite imagery, particularly from instruments like EPIC at the L1 point, offers a global, consistent view unmatched by ground-based observations. EPIC's 10 spectral channels (317–780 nm) capture data across the sunlit Earth, enabling real-time monitoring of these signs without gaps.
How EPIC Monitors Vital Signs
EPIC uses its spectroradiometer to take narrow-band images every 60–100 minutes, producing data products through wavelength-specific analysis. For example, ratios of channels correct for atmospheric effects, yielding maps of ozone concentration or aerosol height. This data is processed to track daily and long-term trends, contributing to global environmental monitoring.
With a resolution of ~8x8 km at the equator (downsampled to 1024x1024 pixels), EPIC provides detailed yet planetary-scale insights, building an archive since 2015 that's accessible via our site's historical views.
Key Vital Signs Monitored by EPIC
Here are the primary indicators EPIC tracks, each vital for planetary health:
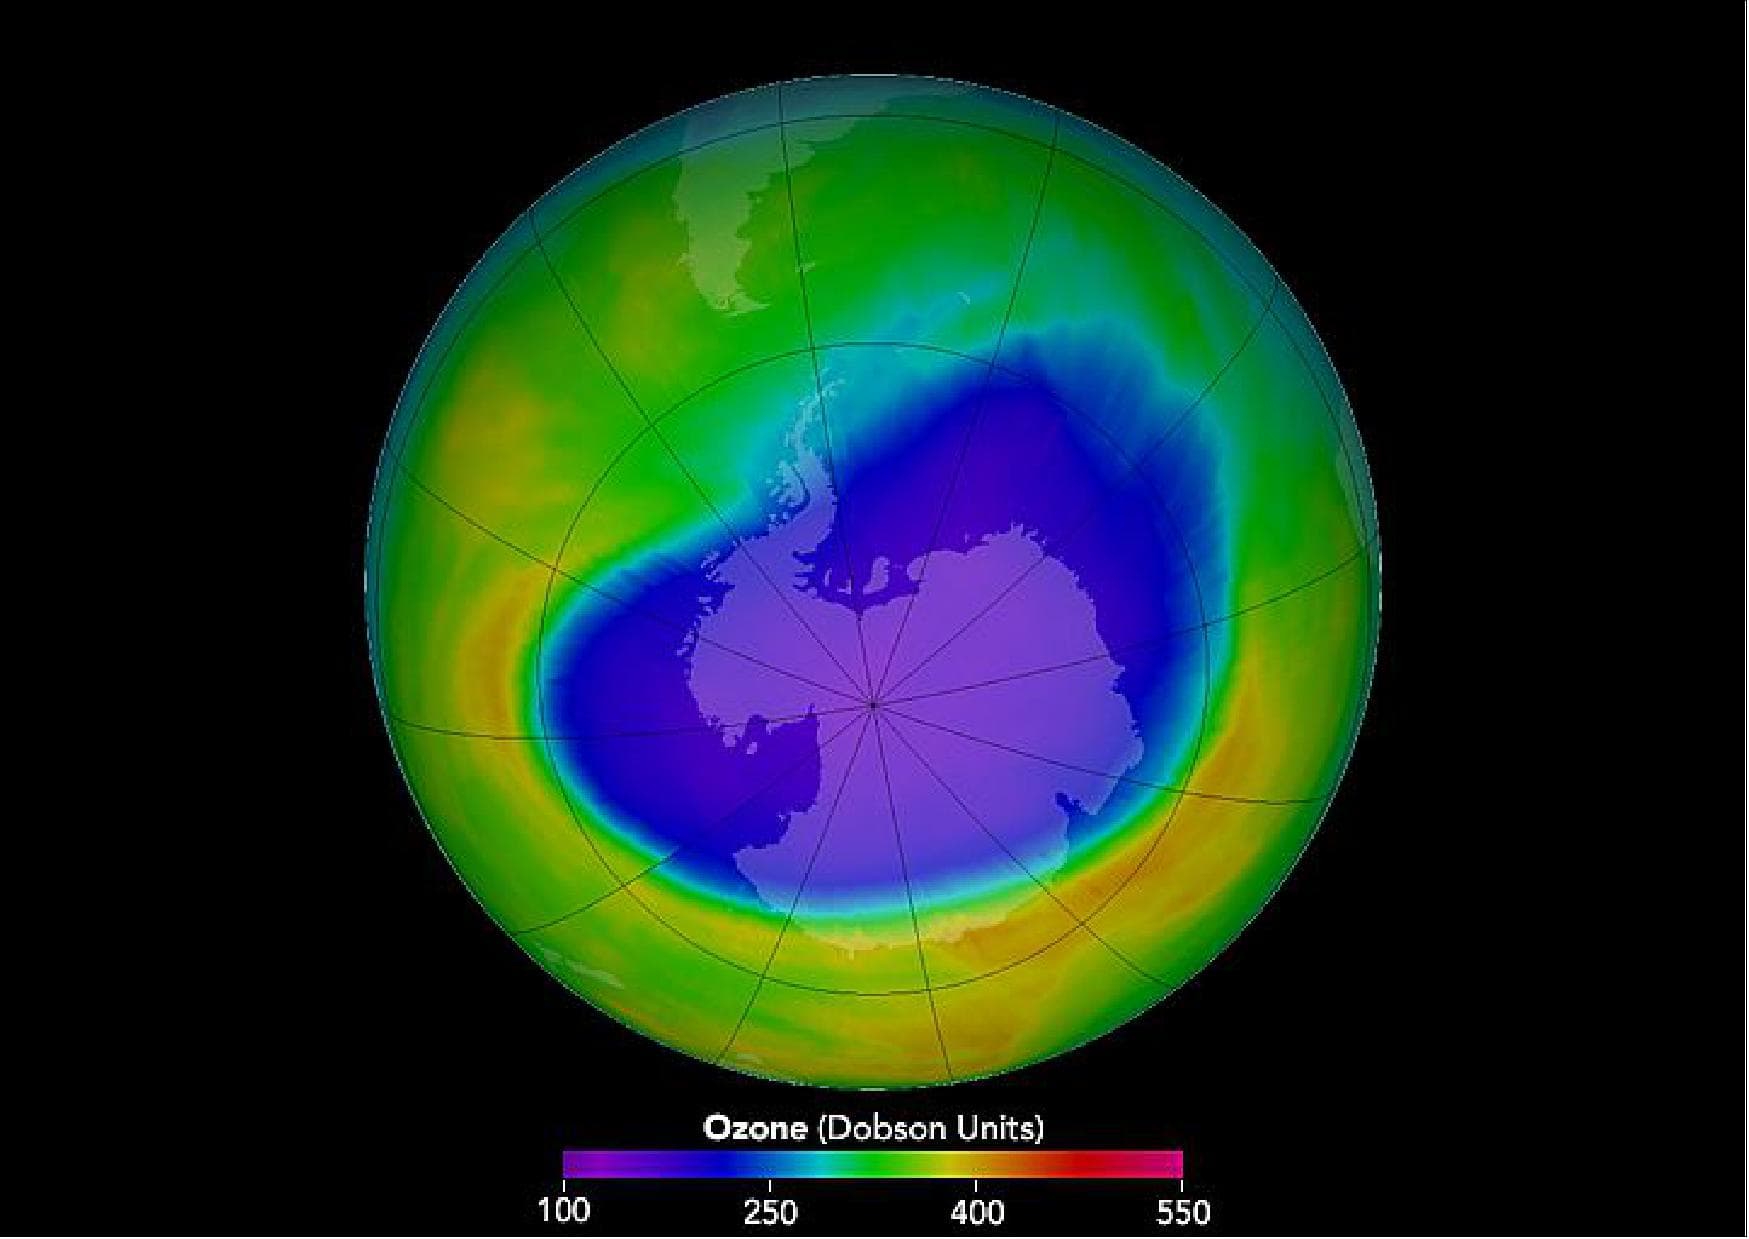
Ozone Levels
Measured using UV channels (317.5 nm, 325 nm, 340 nm), ozone protects life from harmful solar radiation. EPIC detects depletions, like the Antarctic ozone hole, and tracks recovery efforts under international agreements.
Aerosols
Channels (340 nm, 388 nm, 443 nm, 551 nm, 680 nm) monitor tiny particles from dust, smoke, or pollution. Aerosols affect air quality, cloud formation, and climate by scattering sunlight—EPIC tracks plumes from wildfires or volcanoes globally.
Cloud Properties
Using bands (388 nm, 680 nm, 687.75 nm, 779.5 nm), EPIC assesses cloud height, reflectivity, and coverage. Clouds regulate Earth's temperature; changes signal weather patterns or climate shifts, visible in our daily image sequences.
Vegetation Health
Visible and near-infrared channels (551 nm, 680 nm, 779.5 nm) calculate indices like NDVI to gauge plant vitality. This reveals deforestation, droughts, or seasonal growth, linking to carbon cycles and food security.

UV Radiation
Estimated from UV channels, this measures surface exposure, impacting ecosystems and human health. EPIC data helps predict UV indices and study ozone-aerosol interactions.
Sulfur Dioxide (SO₂)
Detected in UV bands, SO₂ from eruptions or industry affects acid rain and respiratory health. EPIC provides rapid detection for hazard warnings.
Scientific Importance
EPIC's contributions extend to climate research: Tracking aerosols and clouds informs radiative forcing models, while vegetation and ozone data support biodiversity and atmospheric studies. Combined with other satellites, this builds a comprehensive picture of Earth's energy balance and response to change, aiding predictions for extreme weather or environmental policies.
Over time, the archive reveals trends like increasing aerosol events from climate-amplified wildfires, emphasizing the need for ongoing monitoring. These trends are central to understanding climate change visible from space.
Fun Facts and Why It Matters
- Global Coverage: EPIC sees 67% of Earth as cloudy on average, but its vital signs data shows how this varies, influencing everything from solar energy to aviation.
- Health Guardian: Ozone monitoring by EPIC continues the legacy of discovering the ozone hole in the 1980s, leading to the Montreal Protocol's success.
- Daily Relevance: These signs aren't abstract—they affect your weather, air quality, and even crop yields, making space-based observation essential for a sustainable future.
Explore Further
Monitor these vital signs in action on DailyEarthView.com. Explore today's data on the homepage or compare long-term trends in our archive. For more, head back to the Learn section and discover topics like cloud changes or the L1 point.
All information derived from NASA's EPIC mission. For detailed data, visit NASA's EPIC page.