The Science of Satellite Imagery
•
Uncover the fascinating world of satellite imagery and how multispectral techniques reveal hidden layers of Earth's systems, as demonstrated by NASA's EPIC camera on the DSCOVR spacecraft. Beyond the beautiful natural-color views on DailyEarthView.com, these images hold scientific treasures—detecting invisible pollutants, monitoring vegetation health, and tracking atmospheric changes. Our daily snapshots and time slider let you explore these insights interactively. Let's dive into the science that makes it all possible.
What Is Satellite Imagery?
Satellite imagery involves capturing photographs or data from space-based sensors to observe Earth's surface, atmosphere, and oceans. It ranges from simple visible-light photos to advanced multispectral or hyperspectral scans that detect electromagnetic radiation beyond what the human eye can see.
EPIC, a polychromatic imaging camera, uses a telescope and CCD detector to capture Earth's full sunlit disk in high resolution. This data not only creates the stunning visuals on our site but also supports environmental monitoring by analyzing light reflected from the planet.
Multispectral Imaging Explained
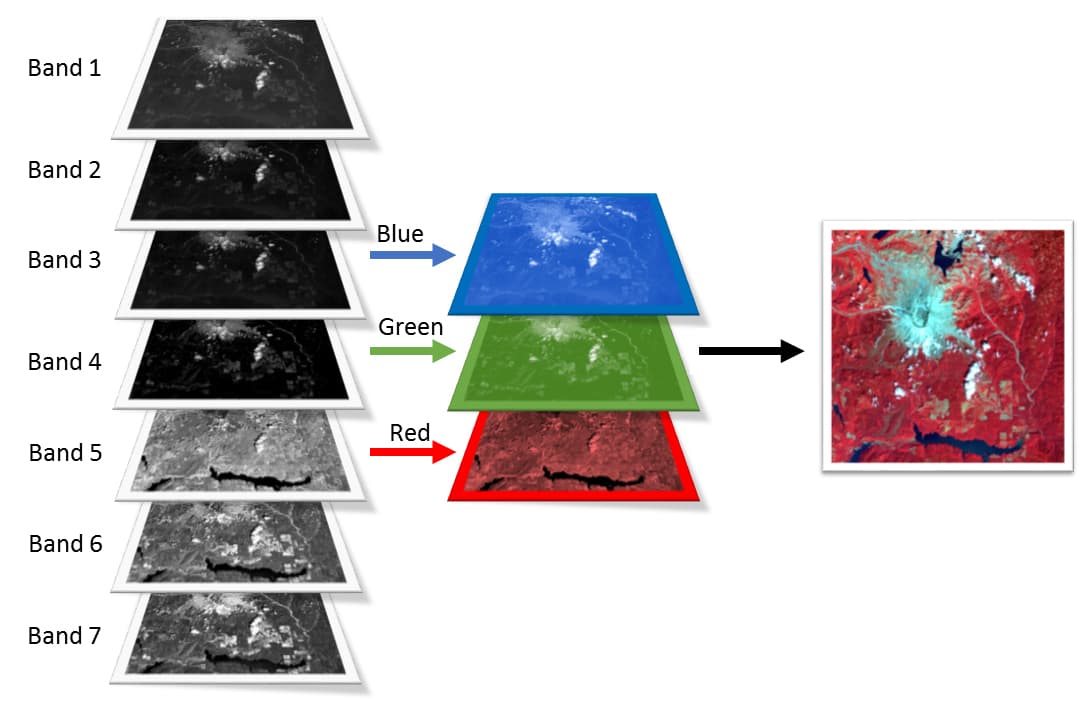
Multispectral imaging divides the electromagnetic spectrum into discrete bands (e.g., ultraviolet, visible, near-infrared), each sensitive to specific surface or atmospheric properties. Unlike panchromatic (black-and-white) images that capture broad light ranges, multispectral data allows for "false color" composites where bands are assigned colors to highlight features.
For instance, combining near-infrared (healthy vegetation reflects strongly) with red and green bands can make plants appear bright red in false color, revealing deforestation or crop health invisible in true color.
EPIC employs 10 narrow bands from 317 nm (UV) to 780 nm (near-IR), enabling precise measurements without the broader coverage of hyperspectral sensors.
How EPIC Applies Multispectral Science
EPIC's bands are tailored for Earth science: UV channels (317–340 nm) detect ozone and SO₂, blue/violet (388–443 nm) track aerosols, green/red (551–680 nm) assess vegetation and clouds, and oxygen absorption bands (687.75–764 nm) measure cloud height via differential absorption.
By processing these, scientists create products like aerosol index maps or vegetation indices (e.g., NDVI), turning raw data into insights on air quality or biomass. On DailyEarthView.com, while we display natural-color composites, the underlying multispectral data powers the detailed analysis of Earth's vital signs. These same techniques enable the direct observation of our planet's appearance and beauty from 1 million miles away.
Revealing Hidden Aspects of Earth's Systems
Multispectral imaging unveils what true-color misses:
- Atmosphere: Aerosols from dust or smoke appear in UV/blue bands, tracking pollution plumes.
- Land and Vegetation: Near-IR highlights chlorophyll, showing healthy forests in bright tones—crucial for monitoring deforestation or droughts.
- Oceans and Water: Bands detect phytoplankton blooms or sediment, indicating ocean health.
- Climate Indicators: Cloud optical thickness and height reveal energy balance shifts.
These revelations help model climate change, predict disasters, and manage resources, all from EPIC's daily 10-13 images.

Applications in Science and Beyond
From agriculture (optimizing irrigation) to disaster response (mapping flood extents), multispectral satellite imagery drives decisions. EPIC's global view complements closer satellites like Landsat, providing planetary-scale data for climate research and space weather forecasting.
Fun Facts and Why It Matters
- Band Magic: EPIC's filters are so precise they can distinguish volcanic ash from regular clouds.
- Historical Leap: Multispectral tech evolved from 1970s Landsat missions, but EPIC adds deep-space continuity.
- Global Impact: This science informs policies on everything from biodiversity to urban planning, emphasizing Earth's interconnected systems.
Explore Further
Dive into these hidden views on DailyEarthView.com. Check the homepage for today's multispectral-derived image, or browse the archive for trends. Explore more in our Learn section, like Earth's vital signs or climate change from space.
All details from NASA's EPIC mission. For more, visit NASA's EPIC page.