Climate Change from Space
•
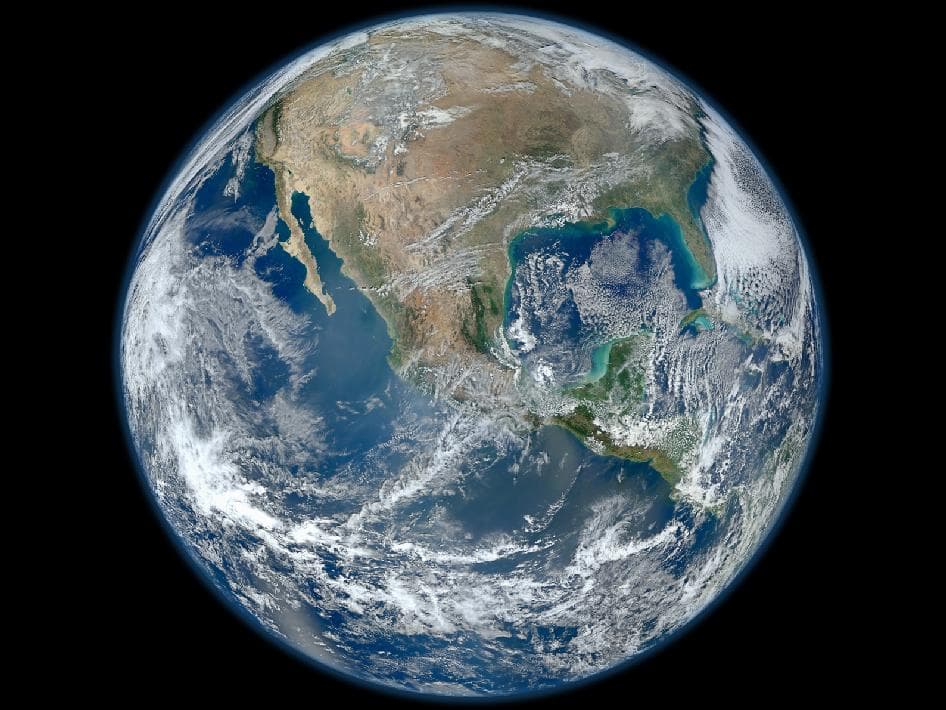
Discover how long-term Earth observation from space, powered by NASA's EPIC camera on the DSCOVR spacecraft, illuminates global climate trends. Since 2015, EPIC's daily images have built a vast archive on DailyEarthView.com, allowing users to compare years of data and spot changes in clouds, ice caps, vegetation, and more through our interactive archive. This bird's-eye view from 1 million miles away reveals the subtle yet profound impacts of climate change, helping scientists predict future scenarios and inform policy. Let's explore the trends visible from orbit.
The Power of Long-Term Satellite Data
Satellites like DSCOVR provide consistent, global datasets over decades, far surpassing sporadic ground measurements. EPIC's 10 spectral bands capture daily snapshots of Earth's sunlit side, tracking variables like albedo (reflectivity), aerosol levels, and vegetation indices. By analyzing trends across years, researchers identify patterns such as rising sea levels, shifting weather systems, and ecosystem disruptions.
This longitudinal approach—comparing "this day in history" views on our site—highlights gradual changes that might otherwise go unnoticed, like the slow greening of the Arctic or expanding desert regions.
Key Climate Trends Observed from Space
EPIC and complementary satellites reveal stark evidence of a warming world:
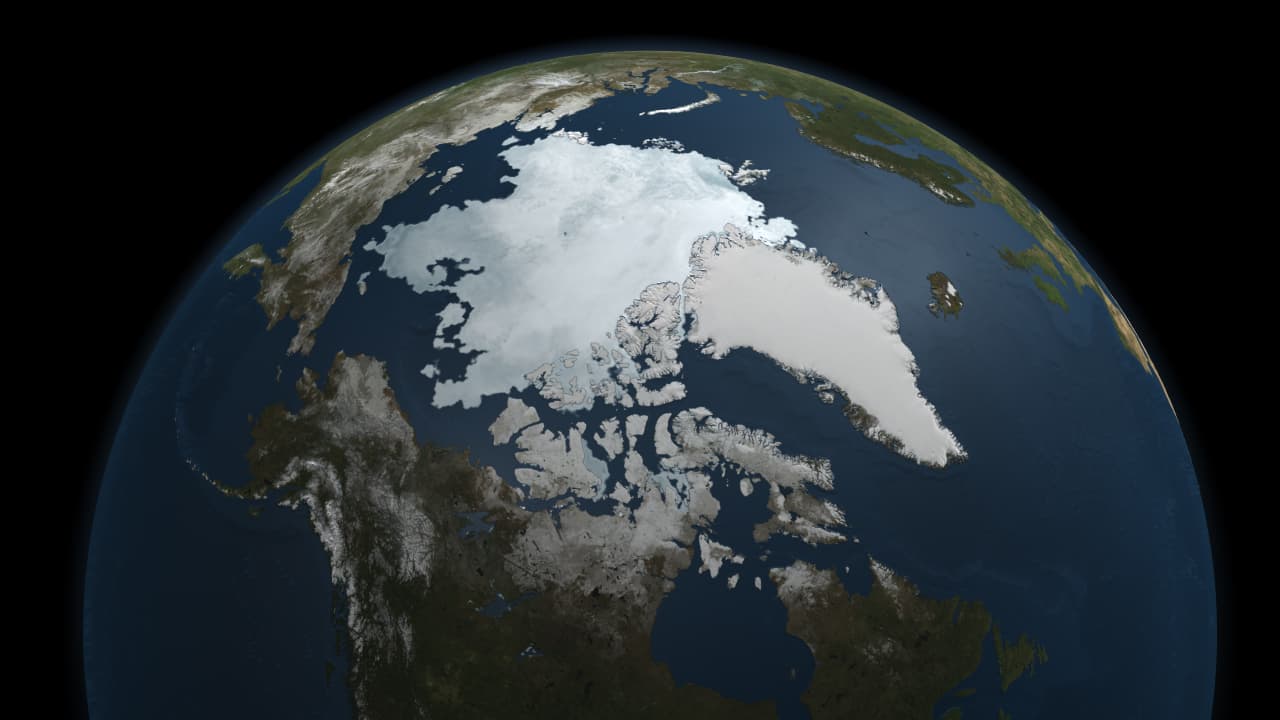
Polar Ice Melt
Arctic sea ice extent has declined by about 13% per decade since 1979, with EPIC images showing thinner, more fragmented ice caps. This amplifies warming via reduced albedo, as dark oceans absorb more heat.
Glacier and Ice Sheet Retreat
Greenland and Antarctic ice sheets are losing mass rapidly—Greenland alone contributes ~0.7 mm to annual sea level rise. Multispectral data tracks elevation changes and melt ponds, visible in time-lapse comparisons.

Changing Cloud Patterns
Warmer temperatures alter cloud formation, with EPIC detecting increased high-altitude clouds that trap heat and fewer low clouds that reflect sunlight, exacerbating global warming.
Vegetation Shifts
NDVI measurements show "greening" in northern latitudes due to longer growing seasons, but "browning" in tropics from droughts and deforestation.
Extreme Events
More frequent wildfires, hurricanes, and floods appear as aerosol plumes or flooded landscapes in EPIC's daily views, linking to climate-driven intensification.
Our archive lets you witness these trends firsthand, such as comparing summer ice coverage from 2015 to now.
Scientific Insights and Global Implications
EPIC data integrates with models from IPCC reports, quantifying feedback loops like permafrost thaw releasing methane. It supports early warnings for events like coral bleaching or crop failures, aiding adaptation strategies.
By providing unbiased, planetary-scale evidence, space-based observation underscores the urgency of reducing emissions, as seen in trends like ocean acidification visible through chlorophyll changes. These observations rely on advanced multispectral imaging techniques and continuous monitoring of Earth's vital signs.
Fun Facts and Why It Matters
- Visible Acceleration: Earth's rotation is slowing slightly due to melting ice redistributing mass, a change EPIC helps monitor through precise positioning data.
- Decade of Data: EPIC's archive now spans over 10 years, equivalent to ~40,000 full-disk images— a treasure trove for AI-driven trend analysis.
- Call to Action: These views from space remind us that climate change is a shared global challenge, visible without borders, urging collective efforts for sustainability.
Explore Further
Track these trends on DailyEarthView.com. Compare historical images in the archive or view today's snapshot on the homepage. For more, explore the Learn section topics like satellite imagery science, Earth's vital signs, and the future of Earth observation to understand what comes next.
All insights based on NASA's EPIC mission and related studies. For more details, visit NASA's EPIC page.